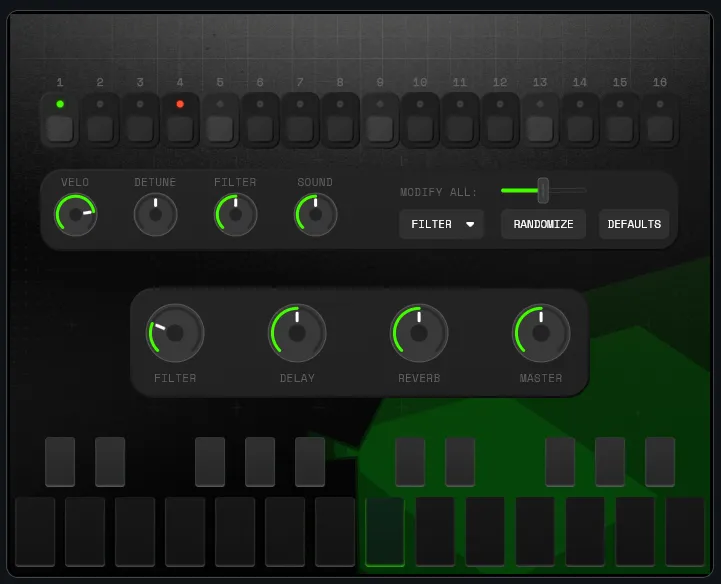
UI: The Spectrum Visualizer
The final piece is a realtime spectrum visualizer that lives on the background surface of the instrument — visible beneath all the controls, responding to whatever the sequencer is playing. It reads the FFT power spectrum from the master volume processor and uses nine frequency bins to draw a closed polygon that pulses and shifts with the bass content.
Create the Form
Section titled “Create the Form”Right-click patches -> main -> ui and choose Create new Form. Name it
visualizer.
The form declares a single canvas control that fills the form:
# form: "visualizer"
width: 560height: 400controls:  canvas:    anchors: { left: 0, top: 0, right: 0, bottom: 0 }    type: canvas    props:      onPaint: on_paint
The canvas control has no visual appearance of its own — it is a blank surface
that calls on_paint whenever it needs to be redrawn. All of the visualizer’s
output comes from the Lua script.
Press Apply after entering the YAML.
Lua Script
Section titled “Lua Script”Before entering the script, copy the UID of the master Amp processor from the
main.flr layer editor: right-click the processor name in its headline and
choose Copy Parameter UID. You will need to paste it into the first line of
the script below.
-- copy the UID of the master Amp here; this is the point in the audio graph-- where the spectrum will be pulled from:local masterVolumeProcessorId = "<copy your own id from the editor>"
-- we draw 3 copies of the shape on top of each other in different colour shades:local paint1 = {color = "#20a1", blendMode = "difference"}local paint2 = {color = "#30a1", blendMode = "difference"}local paint3 = {color = "#40a1", blendMode = "difference"}
-- we evaluate 9 distinct bins taken from a broader spectrum:local numBins = 9
-- the full spectrum we subscribe to has more bins than we will actually use:local numFullSpectrumBins = 72
-- these are the 9 bins the drawing is based on:local freqBins
-- sweep around the full circle in 9 equal steps:local angleInc = math.pi * 2 / numBins
-- we subscribe to a full spectrum but consider only a subset;-- this is the first bin we are interested in:local firstBin = 22
-- called every time a new spectrum arrives:function onFullSpectrumChanged(bins)  if freqBins == nil then    freqBins = {}  end
  -- copy 9 bins starting from firstBin:  for i = 1, numBins do    freqBins[i] = bins[firstBin + i - 1]  end
  -- trigger a repaint whenever new data arrives:  sys_canvas_repaint("canvas")end
sys_subscribe_to_level_collector(  masterVolumeProcessorId,  -- processor at which the spectrum is collected  "spectrum",               -- collector type  -1,                       -- combine all channels  numFullSpectrumBins,      -- total bins to subscribe to  onFullSpectrumChanged)    -- callback
-- named paths, one per drawing layer:local pathName1 = "lines1"local pathName2 = "lines2"local pathName3 = "lines3"
function on_paint(ctrlName, ctx, width, height)  if freqBins == nil then    return  end
  sys_canvas_path_create(ctx, pathName1)  sys_canvas_path_create(ctx, pathName2)  sys_canvas_path_create(ctx, pathName3)
  local centerX = width / 2  local centerY = height / 2
  local angle = 0  local move = true
  for i = 1, numBins do    local energy = freqBins[i] * 0.5
    local dotX = math.sin(angle) * width    local dotY = math.cos(angle) * height
    if move then      sys_canvas_path_move_to(ctx, pathName1, dotX * energy + centerX, dotY * energy + centerY)
      energy = energy * 0.5      sys_canvas_path_move_to(ctx, pathName2, dotX * energy + centerX, dotY * energy + centerY)
      energy = energy * 0.5      sys_canvas_path_move_to(ctx, pathName3, dotX * energy * 0.3 + centerX, dotY * energy * 0.3 + centerY)      move = false    else      sys_canvas_path_line_to(ctx, pathName1, dotX * energy + centerX, dotY * energy + centerY)
      energy = energy * 0.5      sys_canvas_path_line_to(ctx, pathName2, dotX * energy + centerX, dotY * energy + centerY)
      energy = energy * 0.5      sys_canvas_path_line_to(ctx, pathName3, dotX * energy + centerX, dotY * energy + centerY)    end
    angle = angle + angleInc  end
  sys_canvas_path_close(ctx, pathName1)  sys_canvas_path_close(ctx, pathName2)  sys_canvas_path_close(ctx, pathName3)
  sys_canvas_draw_path(ctx, paint1, pathName1)  sys_canvas_draw_path(ctx, paint2, pathName2)  sys_canvas_draw_path(ctx, paint3, pathName3)end
Note: Before pressing Apply, make sure you have replaced the placeholder in the
masterVolumeProcessorIdline with the UID you copied above. The visualizer will silently show nothing if this value is missing or wrong.
Press Apply after entering the script.
How It Works
Section titled “How It Works”Spectrum Subscription
Section titled “Spectrum Subscription”sys_subscribe_to_level_collector taps into the audio graph at the master Amp
processor and requests a 72-bin FFT power spectrum. The callback
onFullSpectrumChanged fires whenever new spectrum data is available. Of the 72
bins, only 9 are used — bins 22 through 30, selected via firstBin = 22. These
sit in the lower-mid frequency range appropriate for a bass instrument. Each
incoming update copies those 9 values into freqBins and calls
sys_canvas_repaint, queuing a redraw.
Drawing the Polygon
Section titled “Drawing the Polygon”on_paint runs whenever the canvas redraws. It creates three named paths, then
iterates the 9 bins in a loop. Each bin maps to a point along an imaginary ray
originating from the canvas centre, at an angle of i × 2π/9 — sweeping evenly
around a full circle. The distance from the centre is proportional to that bin’s
energy: a quiet bin places its point close to the centre; a loud bin pushes it
outward.
The three paths are scaled copies of the same shape:
| Path | Scale relative to energy |
|---|---|
lines1 | full energy |
lines2 | half energy |
lines3 | one sixth energy |
After all 9 points are added, each path is closed to form a polygon and drawn in
sequence using sys_canvas_draw_path. The "difference" blend mode means
overlapping layers invert each other’s colours, producing the shifting, layered
glow effect without any explicit fade or decay logic.
Add to the Main Form
Section titled “Add to the Main Form”Because the visualizer sits behind all other controls, it must be the first
entry in the main form’s controls block — the platform renders controls in
declaration order, so the first one lands at the bottom of the stack.
Open the main form’s YAML and add visualizer before steps:
width: 700height: 560controls:  bg_image:    anchors: { left: 0, top: 0, right: 0, bottom: 0 }    type: image    props:      image: plugin_bg.png
  visualizer:    anchors: { left: 0, top: 160, bottom: -160, right: 0 }    type: subForm    props:      form: visualizer
  steps:    pos: { x: 30, y: 63, w: 640, h: 72 }    type: subForm    props:      form: step_grid
  stepControls:    pos: { x: 30, y: 155, w: 640, h: 82 }    type: subForm    props:      form: step_controls
  master:    pos: { x: 120, y: 274, w: 460, h: 110 }    type: subForm    props:      form: main_controls
  keyboard:    pos: { x: 5, y: 423, w: 690, h: 130 }    type: subForm    props:      form: keyboard
The z-order from bottom to top is now: background image → visualizer → all
controls. Adjust the visualizer pos values to taste. Press Apply.
Start playback and watch the polygon breathe and shift with the bass content.